Showing posts with label JSON. Show all posts
Return DataTable WebMethod ASP.Net

Return DataTable WebMethod ASP.Net

Description:-

In this article we will return data table from WebMethod and using Json we will bind html table.
JSON (JavaScript Object Notation) is a lightweight data-interchange format. It is easy for humans to read and write. It is easy for machines to parse and generate. It is based on a subset of the JavaScript Programming LanguageStandard ECMA-262 3rd Edition - December 1999. JSON is a text format that is completely language independent but uses conventions that are familiar to programmers of the C-family of languages, including C, C++, C#, Java, JavaScript, Perl, Python, and many others. These properties make JSON an ideal data-interchange language.
JSON is built on two structures:
  • A collection of name/value pairs. In various languages, this is realized as an object, record, struct, dictionary, hash table, keyed list, or associative array.
  • An ordered list of values. In most languages, this is realized as an array, vector, list, or sequence.
These are universal data structures. Virtually all modern programming languages support them in one form or another. It makes sense that a data format that is interchangeable with programming languages also be based on these structures.

Here is an example of JSON data:
{
     "firstName": "Umesh",
     "lastName": "Patel",
     "address": {
         "streetAddress": "Ahmedabad",
         "city": "Ahmedabad",
         "state": "Gujrat",
         "postalCode": 560010
     },
     "phoneNumbers": [
         "999 999 9999",
         "999 999 9999"
     ]
 }
Download JQuery :- Jquery.min.js

Default.aspx:-

<!DOCTYPEhtmlPUBLIC"-//W3C//DTD XHTML 1.0 Transitional//EN""http://www.w3.org/TR/xhtml1/DTD/xhtml1-transitional.dtd">
<htmlxmlns="http://www.w3.org/1999/xhtml">
<headrunat="server">
<styletype="text/css">
body
{
  font-family: Arial;
  font-size: 10pt;
}
table
{
  border: 1pxsolid#ccc;
  border-collapse: collapse;
  background-color: #fff;
  width: 200px;
}
table th
{
  background-color: #B8DBFD;
  color: #333;
  font-weight: bold;
}
table th, table td
{
  padding: 5px;
  border: 1pxsolid#ccc;
}
table, table table td
{
  border: 0pxsolid#ccc;
}
</style>
<script src="JS/jquery.min.js" type="text/javascript"></script>
<script type="text/javascript">
$(function () {
  $.ajax({
       type: "POST",
       url: "Return_DataTable_WebMethod.aspx/GetCustomers",
       data: '{}',
       contentType: "application/json; charset=utf-8",
       dataType: "json",
       success: OnSuccess,
       failure: function (response) {
          alert(response.responseText);
       },
       error: function (response) {
       alert(response.responseText);
         }
       });
    });
 
function OnSuccess(response) {
       var xmlDoc = $.parseXML(response.d);
       var xml = $(xmlDoc);
       var customers = xml.find("Customers");
       var table = $("#dvCustomers table").eq(0).clone(true);
           $("#dvCustomers table").eq(0).remove();
           $(customers).each(function () {
               $(".name", table).html($(this).find("ContactName").text());
               $(".city", table).html($(this).find("City").text());
               $(".postal", table).html($(this).find("PostalCode").text());
               $(".country", table).html($(this).find("Country").text());
               $(".phone", table).html($(this).find("Phone").text());
               $(".fax", table).html($(this).find("Fax").text());
               $("#dvCustomers").append(table).append("<br />");
           table = $("#dvCustomers table").eq(0).clone(true);
           });
        }
</script>
</head>
<body>
<form id="form1" runat="server">
<div>
  <div id="dvCustomers">
    <table class="tblCustomer" cellpadding="2" cellspacing="0" border="1">
    <tr>
      <th>
         <b><u><span class="name"></span></u></b>
      </th>
    </tr>
    <tr>
      <td>
        <b>City: </b><spanclass="city"></span>
        <br/>
        <b>Postal Code: </b><spanclass="postal"></span>
        <br/>
        <b>Country: </b><spanclass="country"></span>
        <br/>
        <b>Phone: </b><spanclass="phone"></span>
        <br/>
        <b>Fax: </b><spanclass="fax"></span>
        <br/>
      </td>
    </tr>
    </table>
  </div>
</div>
</form>
</body>
</html>

Default.aspx.cs:-

[WebMethod]
public static string GetCustomers()
{
  string constr = ConfigurationManager.ConnectionStrings["DBCS"].ConnectionString;
  using (SqlConnection con = newSqlConnection(constr))
  {
    using (SqlCommand cmd = newSqlCommand("SELECT TOP 10 * FROM Customers"))
    {
      cmd.Connection = con;
      DataSet ds = newDataSet();
      using (SqlDataAdapters da = newSqlDataAdapter(cmd))
      {
        sda.Fill(ds, "Customers");
      }
    return ds.GetXml();
    }
  }
}
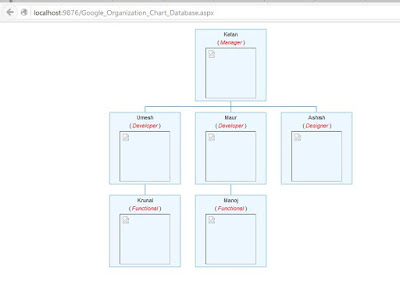
How to Create Organization Chart using google API in Asp.Net


Here we will see How to Create Organization Chart using google API in Asp.Net also using JavaScript through in dotnet.

TABLE:
CREATE TABLE [dbo].[EmployeesHierarchy](
      [EmployeeId] [int] IDENTITY(1,1) NOT NULL,
      [Name] [varchar](100) NOT NULL,
      [Designation] [varchar](30) NOT NULL,
      [ReportingManager] [int] NULL,
 CONSTRAINT [PK_EmployeesHierarchy] PRIMARY KEY CLUSTERED
(
      [EmployeeId] ASC
)WITH (PAD_INDEX  = OFF, STATISTICS_NORECOMPUTE  = OFF, IGNORE_DUP_KEY = OFF, ALLOW_ROW_LOCKS  = ON, ALLOW_PAGE_LOCKS  = ON) ON [PRIMARY]
) ON [PRIMARY]

GO

HTML CODE:
<div>
    <script type="text/javascript" src="http://ajax.googleapis.com/ajax/libs/jquery/1.8.3/jquery.min.js"></script>
    <script type="text/javascript" src="https://www.google.com/jsapi"></script>
    <script type="text/javascript">
        google.load("visualization", "1", { packages: ["orgchart"] });
        google.setOnLoadCallback(drawChart);
        function drawChart() {
            $.ajax({
                type: "POST",
                url: "Google_Organization_Chart_Database.aspx/GetChartData",
                data: '{}',
                contentType: "application/json; charset=utf-8",
                dataType: "json",
                success: function (r) {
                    var data = new google.visualization.DataTable();
                    data.addColumn('string', 'Entity');
                    data.addColumn('string', 'ParentEntity');
                    data.addColumn('string', 'ToolTip');
                    for (var i = 0; i < r.d.length; i++) {
                        var employeeId = r.d[i][0].toString();
                        var employeeName = r.d[i][1];
                        var designation = r.d[i][2];
                        var reportingManager = r.d[i][3] != null ? r.d[i][3].toString() : '';
                        data.addRows([[{ v: employeeId,
                            f: employeeName + '<div>(<span>' + designation + '</span>)</div><img src = "Pictures/' + employeeId + '.jpg" />'
                        }, reportingManager, designation]]);
                    }
                    var chart = new google.visualization.OrgChart($("#chart")[0]);
                    chart.draw(data, { allowHtml: true });
                },
                failure: function (r) {
                    alert(r.d);
                },
                error: function (r) {
                    alert(r.d);
                }
            });
        }
    </script>
    <div id="chart">
    </div>
    </div>

STYLE SHEET:
<style type="text/css">
        body
        {
            font-family: Arial;
            font-size: 10pt;
        }
        #chart
        {
            width: 900px;
            height: 500px;
        }
        #chart div
        {
            width: 130px;
        }
        #chart span
        {
            color: red;
            font-size: 8pt;
            font-style: italic;
        }
        #chart img
        {
            height: 100px;
            width: 100px;
        }
    </style>

CODE BEHIND:
[WebMethod]
        public static List<object> GetChartData()
        {
            string query = "SELECT EmployeeId, Name, Designation, ReportingManager";
            query += " FROM EmployeesHierarchy";
            string constr = ConfigurationManager.ConnectionStrings["DBCS"].ConnectionString;
            using (SqlConnection con = new SqlConnection(constr))
            {
                using (SqlCommand cmd = new SqlCommand(query))
                {
                    List<object> chartData = new List<object>();
                    cmd.CommandType = CommandType.Text;
                    cmd.Connection = con;
                    con.Open();
                    using (SqlDataReader sdr = cmd.ExecuteReader())
                    {
                        while (sdr.Read())
                        {
                            chartData.Add(new object[]
                {
                    sdr["EmployeeId"], sdr["Name"], sdr["Designation"] , sdr["ReportingManager"]
                });
                        }
                    }
                    con.Close();
                    return chartData;
                }
            }
        }