Description:-
In this Article we will see how to Create Google Gauge
Chart in dot net. Here I have Generate
Script Dynamically from Database to bind Chart from Script. You can Generate
what event data you will pass in the Database based on that it will Create
Gauge Chart. Here is the Sample Demo Example to Generate Chart.
Default.aspx:-
<div>
  <asp:Literal ID="lt" runat="server"></asp:Literal>
</div>
<div id="chart_div"></div>
Default.aspx.cs:-
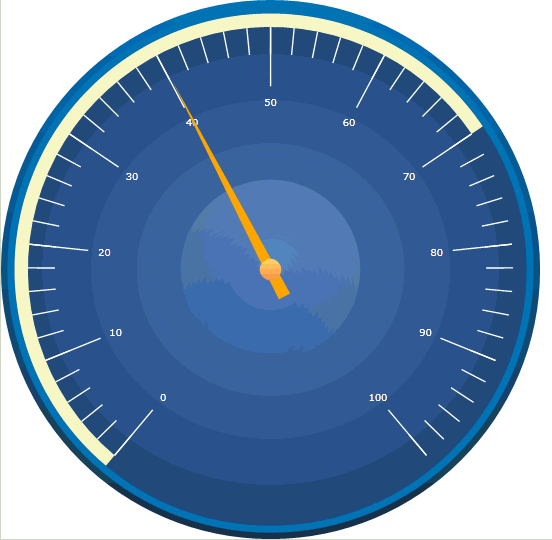
protected void Page_Load(object sender, EventArgs e)
{
  if (Page.IsPostBack == false)
  {
    BindChart();
  }
}

private DataTable GetData()
{
  DataTable dt = new DataTable();
  string cmd = "select Name, Price from products";
  SqlDataAdapter adp = new SqlDataAdapter(cmd, conn);
  adp.Fill(dt);
  return dt;
}

private void BindChart()
{
  DataTable dt = new DataTable();
  try
  {
    dt = GetData();
    str.Append(@"<script type=text/javascript> google.load( *visualization*, *1*, {packages:[*gauge*]});
        google.setOnLoadCallback(drawChart);
        function drawChart() {
           var data = new google.visualization.DataTable();
           data.addColumn('string', 'item');
           data.addColumn('number', 'value');
           data.addRows(" + dt.Rows.Count + ");");
           for (int i = 0; i <= dt.Rows.Count - 1; i++)
           {
             str.Append("data.setValue( " + i + "," + 0 + "," + "'" + dt.Rows[i]["Name"].ToString() + "');");
             str.Append("data.setValue(" + i + "," + 1 + "," + dt.Rows[i]["Price"].ToString() + ") ;");
           }
           str.Append("var options = {width: 600, height: 300,redFrom: 90, redTo: 100,yellowFrom:75, yellowTo: 90,minorTicks: 5};");
           str.Append(" var chart = new google.visualization.Gauge(document.getElementById('chart_div'));");
           str.Append(" chart.draw(data, options); }");
           str.Append("</script>");
           lt.Text = str.ToString().TrimEnd(',').Replace('*', '"');
  }
  catch
  { }
}
Now run your application to Get Data from Database and
Using JavaScript it will Generate Gauge Chart on your Webpage.

2 comments
commentsPésimo tu tutorial!
Replywhat is str in it
ReplyThanks for comments.....